Area Sales Meters
Area Sales Barometer
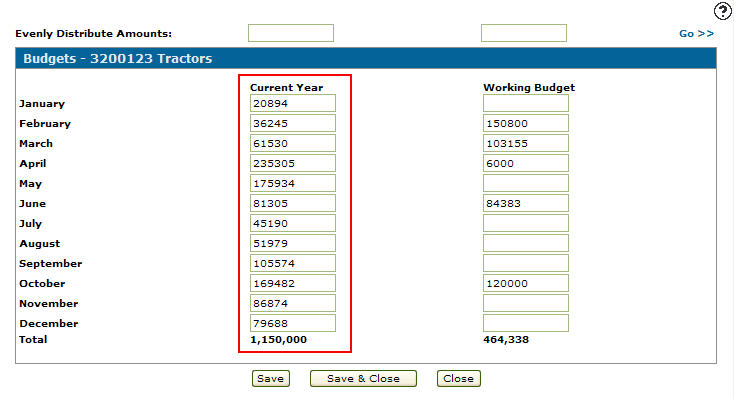
The following will describe the purpose of the color indicators on the Area Sales Barometer:
-
Values in the Red portion of the Barometer represents the lower half of the total budget.
-
Values in the Yellow portion of the Barometer represents the upper half of the total budget.
-
Values in the Green portion of the Barometer represents values above the total budget.
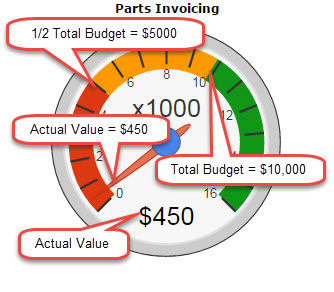
The following will describe the purpose of the color indicator on the Area Sales Speedometer:
-
Values in the Orange portion of the Speedometer indicate that dealership sales have exceeded the total budget.
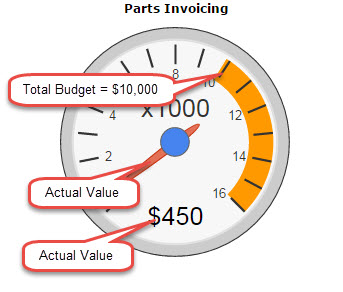
The following describe the purpose of the color indicator on the Area Sales Bar Chart:
-
The Actual Value appears as the Current value displayed on the chart.
- The Total Budget appears as the Goal value displayed on the chart.
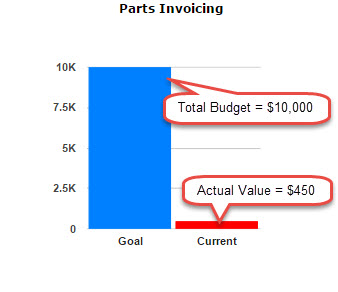
Setup:
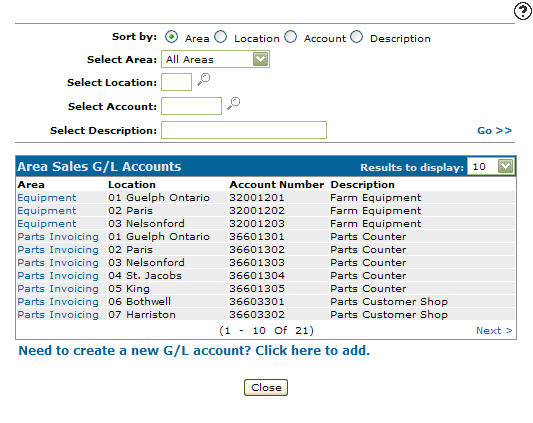
Sales accounts that drive the data on the Area Sales Meters are setup on the Area Sales G/L Accounts screen. To set up an area sales G/L Account click the following procedural link, set up area sales G/L accounts for specified areas and locations.
Budgets that drive the budget color indicator on the Area Sales Meters are setup for the corresponding sales accounts (setup on the Area Sales G/l Accounts screen) in the Current Year fields on the Budgets screen. To set up a budget click the following procedural link, enter the monthly budgets into the system.
Dealerships must be set up their budgets first in order for the Area Sales Meters to display projected budget targets.